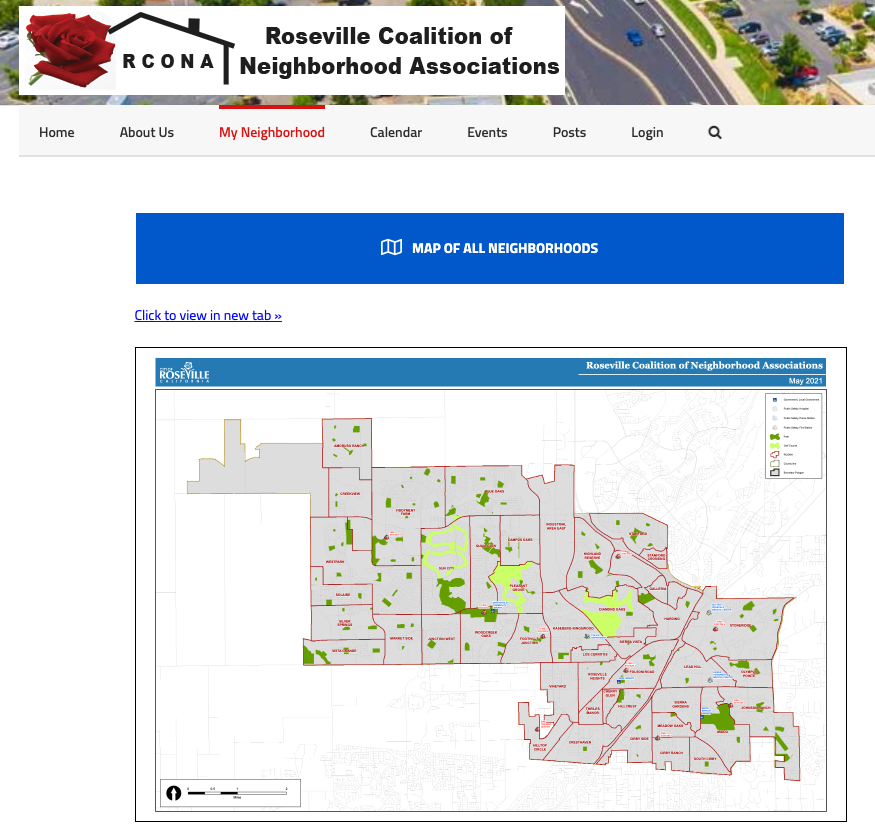
Per an email forwarded to me, RCONA had decided on the names of some new neighborhood associations (NA’s) that have been created on the west side of town. I had already uploaded the PDF version of the map to rcona.org → My Neighborhood → Maps & Links, but it’s been brought to my attention that the new NA’s are not showing up in the ArcGIS interactive map viewer that I had added to the Find my neighborhood page previously.
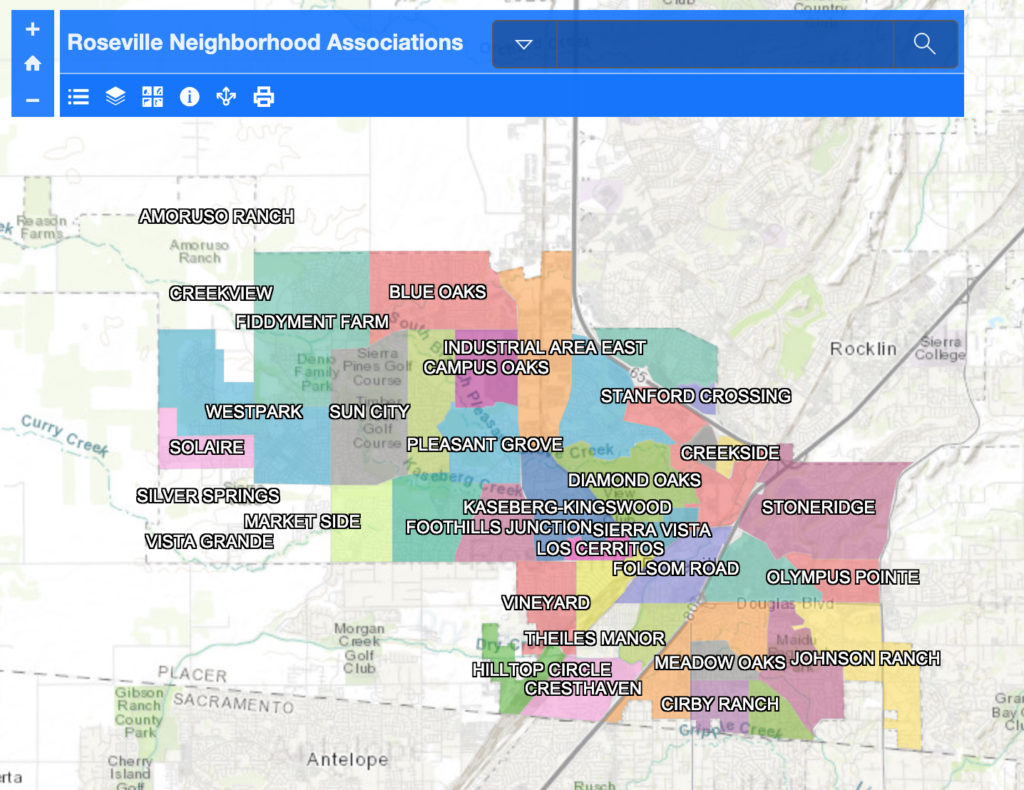
Originally, I had “forked” (clicking “I want to use this → Create a Map”) the NA map provided by the City of Roseville’s GIS Data Portal not only in order to generate an “iframe” (code embeddable to a website in order to show the map within rcona.org so you didn’t have to leave our page), but also to color code the NA’s, since they weren’t already.
It appears that the neighborhoods did already add themselves to my existing map, apparently by means of relying on a common map “source” (“ArcGIS World Geocoding Service” and/or “PropertyInformationToolLayers – Neighborhood Association”), linked from their map that continues to get updated over time. You could click on one of them on my map, and get their attributes that were added after I “forked” this map, coming from their map. But those new NA’s were not getting automatically color-coded, since the “Layer Styles” remained under my control of the forked map. This dynamic would also apply in the case of existing NA’s that get modified, which can be seen in the case of “Cherry Glen” and “Theiles Manor” getting split into two separate NA’s. The NA’s themselves were updated automatically, but not the styles.
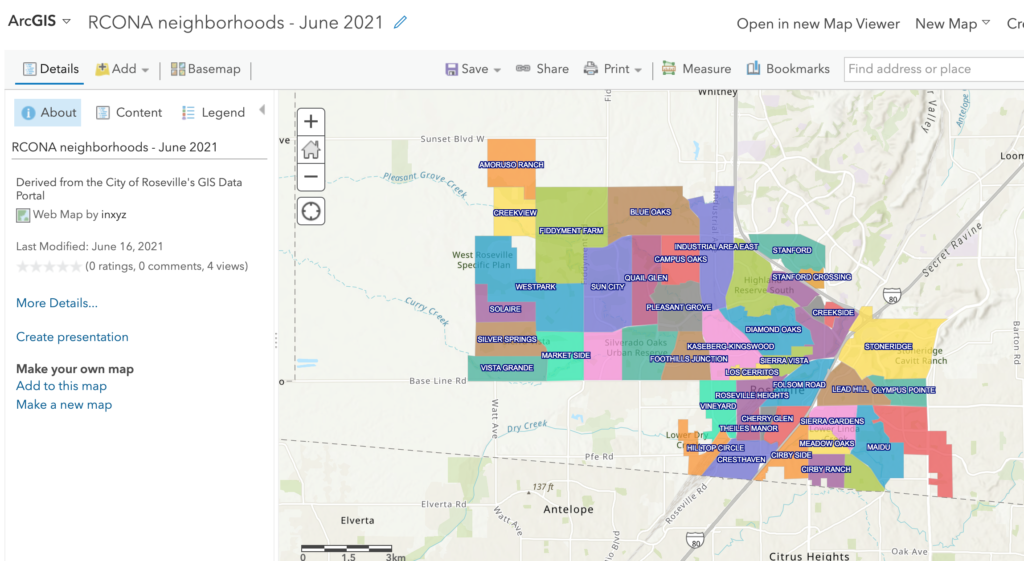
After discussing with the City’s map designer how to proceed with updating this map, he had replied to my email showing me how repeat his steps to edit my map attributes to reassign the color-coding in the Layer Styles. That would regenerate the color coding for these new NA’s so they’re easily seen like the other ones. My old map didn’t seem to have the same editing capabilities that it did before, so I forked the City’s map again and began working with the Layers and Layer Styles from there.
That did the trick. But there was one other thing that I wanted to tackle previously, but couldn’t figure out how to do it before. Since this is an interactive map, if you click on one of the neighborhoods, you would get a pop-up box that lists some information that came from the original map developer:
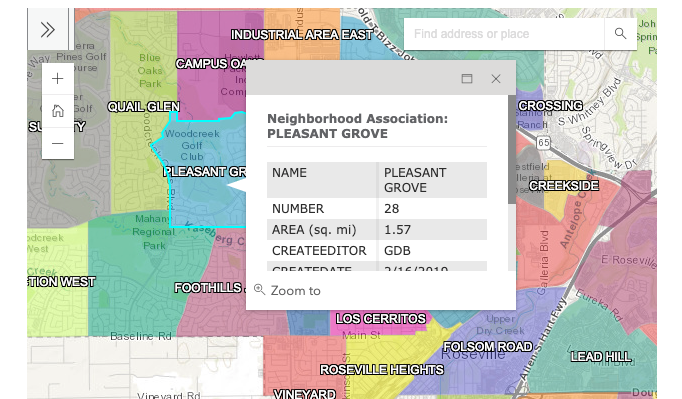
Except for the name of the neighborhood itself, the only other thing that might be interesting to residents is the total area in sq. mi. But are these fields customizable to me, so I can put my own information inside the list of “attributes”? It would be great to provide a link to a given NA’s website, if they have one.
It turns out, yes you can, using Esri’s “Arcade” language for ArcGIS. In my forked map, I found an option to customize the pop-up box that shows up any time you click on an NA. From there, I added a custom “attribute expression”, using their programming language to conditionally select NA’s based on their numerical ID, and provide a link to their website if one exists.
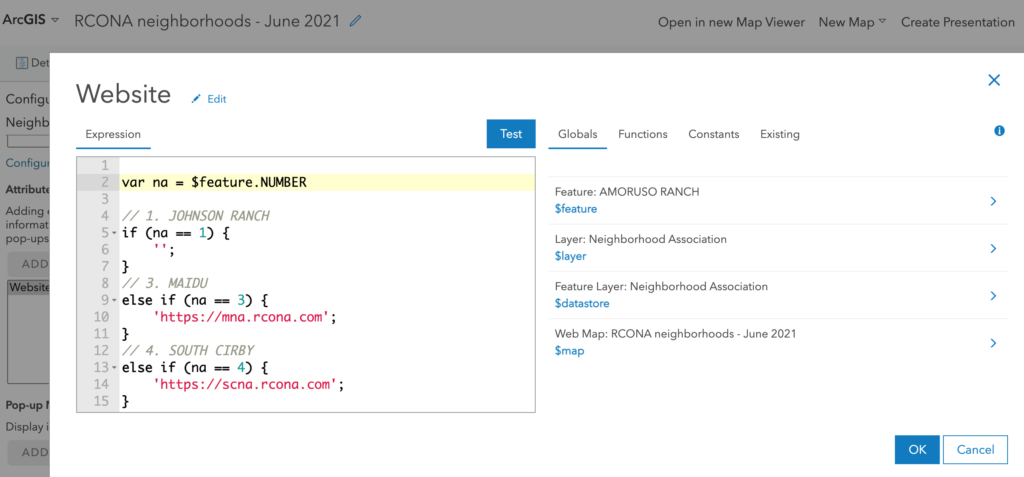
Now if you click on a pop-up box, you’ll get a link to a website for those who have one.
The City of Roseville employee who I talked to recently mentioned he was working on publishing another interactive map for “Finding my Fire District”, so if you’re interested stay tuned, as I’ll see if I can get that posted to our site as well.